 Bullish Hammer
Definition
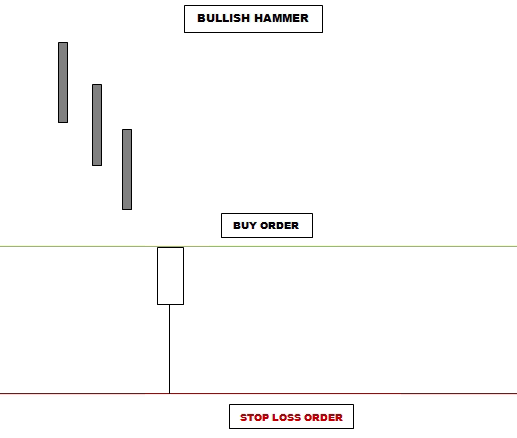
Since it is hammering out of a bottom, this pattern, known as a Hammer, appears at the bottom of a trend or during a downturn. It is a single candlestick pattern with a small body at the top of its daily trading range or very close to it and a long lower shadow.
Recognition Criteria
- The market has a strong downturn that dominates.
- At the upper end of the trading range, a tiny body is seen. The body’s colour is unimportant.
- This candlestick’s lowest shadow is at least twice as long as the body.
- No above shadow is present.
Pattern Requirements and Flexibility
The Hammer’s body should be compact. The lower shadow shouldn’t be any shorter than a typical candlestick, but it should be at least twice as long as the body. It is preferred that the upper shadow be absent or extremely small. The bottom of the Hammer’s body need to be lower than the bases of the two black candlesticks that come before it.
Trader’s Behavior
The Bullish Hammer appears in a downtrend and it sells off sharply following the market open. The market almost reaches its day’s high after the downturn stops. Evidently, the market is unable to move forward on the selling side. The earlier pessimistic emotion is diminished by this finding, which causes short traders to become more apprehensive about their bearish bets. The position for the bulls appears considerably better if the Hammer’s body is white.
Buy/Stop Loss Levels
The top of the Hammer’s body is referred to as the confirmation level. For confirmation, prices must cross over this level.
The previous low is referred to as the stop loss level. The stop loss is triggered if, after the BUY, prices fall instead of rising and close below or make two successive daily lows below the stop loss level without the appearance of a bearish pattern.
 Bullish Belt Hold
Definition
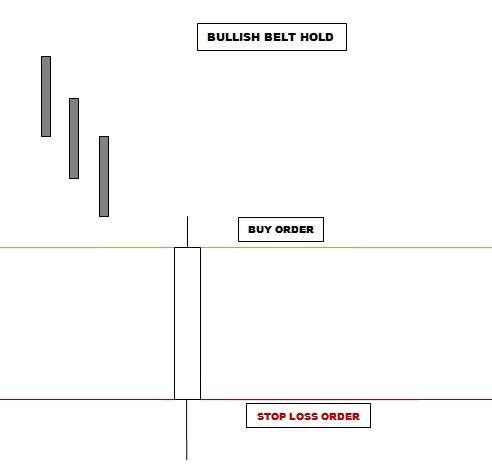
A Bullish Belt Hold is a single candlestick pattern that appears during a decline and is essentially a White Opening Marubozu. It starts off at the day’s low before beginning a rise against the market’s main trend throughout the day. The rally eventually comes to a conclusion with a close near the day’s high, leaving a slight shadow on top of the candle. Longer bodies will provide considerably more resistance to the tendency if the Belt Hold is characterised by it.
Recognition Criteria
- The market has a strong downturn that dominates.
- The market gaps down and opens at its low, and closes near to the high of the day.
- A White Opening Marubozu—a long, white body without a lower shadow—is seen.
Pattern Requirements and Flexibility
In a Bullish Belt Hold, a white opening marubozu or a white marubozu (without an upper or lower shadow) should be visible, and it should open lower than the two black candlesticks that came before it.
Trader’s Behavior
With a sizable gap in the direction of the current downturn, the market opens lower. As a result, the opening price gives the impression that the downward trend will continue. After the market opens, though, things quickly shift, and the market starts moving the other way. The short traders are quite concerned about this, which prompts them to close out numerous positions. This could change the trend and trigger a bullish rise.
Buy/Stop Loss Levels
The final close is referred to as the confirmation level. For confirmation, prices must cross over this level.
The stop loss level is defined as the last low. Following the BUY, if prices go down instead of going up, and close or make two consecutive daily lows below the stop loss level, while no bearish pattern is detected, then the stop loss is triggered.
 Bullish Engulfing
Definition
This pattern, which arises during a decline, is characterised by a big white body enveloping a smaller black body that came before it. The black body’s shadows may not always be completely engulfed by the white body, which also completely engulfs the body itself. This significant bottom reversal signal is present.
Recognition Criteria
- The market has a strong downturn that dominates.
- Day one includes the discovery of a black body.
- The black body from the first day is completely engulfed by the white body that forms on the second day.
Pattern Requirements and Flexibility
Bullish engulfing doesn’t care how long the first black candlestick is as long as it closes. Also, it might be a Doji. The second one must be a standard or long white candlestick, though. The white body should be longer than the earlier black body, regardless of whether the body tops or body bottoms of the two candlesticks are at the same level.
Trader’s Behavior
Although the market is in a slump, the presence of a black body on the first day results in less selling activity. The market debuts at fresh lows the next day. It appears as though there would be more bearish trade, but as the day goes on, the downtrend loses steam and the bulls gain control. Selling pressure finally gives way to purchasing pressure, and the market ends higher than it did at the day’s opening. It is no longer in a downtrend.
Buy/Stop Loss Levels
The final close is referred to as the confirmation level. For confirmation, prices must cross over this level.
The previous low is referred to as the stop loss level. The stop loss is triggered if, after the BUY, prices fall instead of rising and close below or make two successive daily lows below the stop loss level without the appearance of a bearish pattern.
 Bullish Harami
Definition
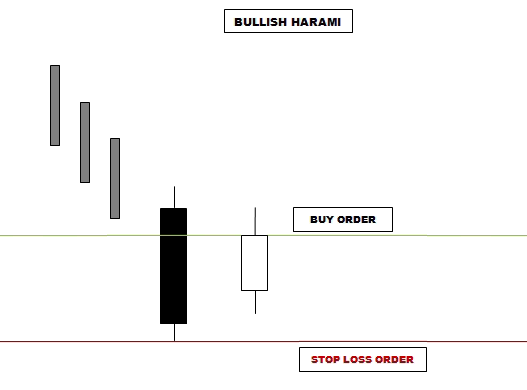
This pattern consists of a small white body that lies entirely within the black body’s viewing range and a black body. If the pattern’s outline is drawn, it resembles a pregnant woman. There is no chance behind this. An ancient Japanese word for “pregnant” is “harami.” The small candlestick represents “the baby,” and the black candlestick serves as “the mother.”
Recognition Criteria
- The market has a strong downtrend that dominates.
- On the first day, a black body is seen.
- The body from the first day totally engulfs the white body that forms on the second day.
Pattern Requirements and Flexibility
The pattern consists of two candlesticks, with the black candlestick on the first day engulfing the white candlestick on the second day. It must be a standard or long black candlestick for the first one. The white body should be smaller than the earlier black body, regardless of whether the body tops or body bottoms of the two candlesticks are at the same height.
Trader’s Behavior
The Bullish Harami indicates that the market’s health is uneven. The market is in a decline with a negative attitude, and there has been significant selling as indicated by a dark body, which strengthens the bearishness. The short traders become concerned when prices start the following day higher or at the close of the day before. The price rises higher as a result of many short positions being covered. The ascent is slowed down by the latecomers who short the trend they first missed. Consequently, a little white body develops. Given that the second day’s real body is small and the bearish power is waning, this could indicate a trend reversal.
Buy/Stop Loss Levels
The last close or the midpoint of the first black body, whichever is higher, is considered the confirmation level. For confirmation, prices must cross over this level.
The lowest of the previous two lows is used to define the stop loss level. The stop loss is triggered if, after the BUY, prices fall instead of rising and close below or make two successive daily lows below the stop loss level without the appearance of a bearish pattern.
 Bullish Doji Star
Definition
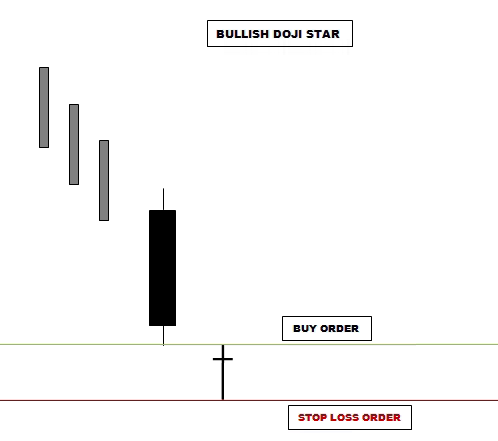
This pattern signals a change in trend when it shows up during a downward trend. It consists of a Doji with a downward gap at the entrance and a black candlestick. The pattern is known as “Bullish Dragonfly Doji” when the Doji takes the shape of an umbrella, and “Bullish Gravestone Doji” when the Umbrella is inverted. Regardless of the Doji’s shape, all of these patterns are grouped together under the moniker “Bullish Doji Star” in this instance.
Recognition Criteria
- The market has a strong downturn that dominates.
- A black candlestick is used on the first day.
- Then, on the second day, we witness a Doji that gaps downward.
Pattern Requirements and Flexibility
A standard or long black candlestick should be the first element of the Bullish Doji Star. The next thing must be a Doji gapping down.
Trader’s Behavior
Strong black candlestick further underscores the market’s decline. The trading is in a narrow range the following day as it starts lower with a gap down. A Doji forms when the day ends at the price it began at. During the downturn, bears were in charge, but the appearance of a Doji Star, which indicates that the bulls and the bears are in harmony, suggests a change presently. The negative vibe is fading away. The odds of a bear market persisting are not good.
Buy/Stop Loss Levels
The middle of the distance between the Doji and the preceding candlestick is known as the confirmation level. For confirmation, prices must cross over this level.
The lowest of the previous two lows is used to define the stop loss level. The stop loss is triggered if, after the BUY, prices fall instead of rising and close below or make two successive daily lows below the stop loss level without the appearance of a bearish pattern.
 Bullish Try Star
Definition
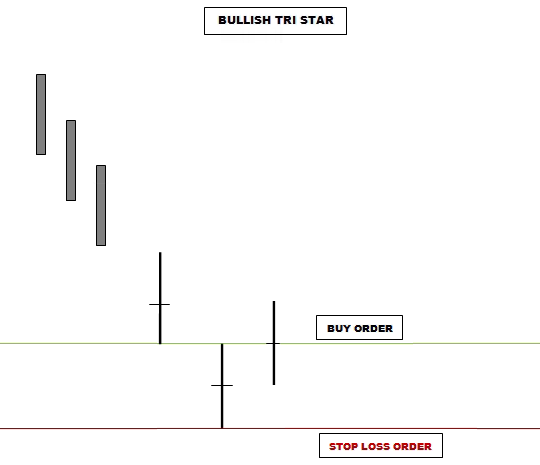
This pattern consists of three Doji in succession. This pattern is highly uncommon, therefore when it does appear, it should not be disregarded.
Recognition Criteria
- The market has a strong downtrend that dominates.
- There are three Doji visible in a row.
- The second day is separated from the first and third by a gap.
Pattern Requirements and Flexibility
The second Doji gaps below the other two Doji to form the Bullish Three Star, which comprises of three Doji in a row. The fact that the gap is a body gap suffices. The space between shadows is not necessary.
Trader’s Behavior
A market that has been in a decline for a considerable amount of time is necessary for a bullish Tri Star. The smaller bodies, on the other hand, are likely a sign of the deteriorating trend. The initial doji raises some red flags. The market is losing direction, as shown by the second Doji. The third doji signals the end of the downturn towards the end. This pattern suggests a lack of decision-making that caused positions to be switched.
Buy/Stop Loss Levels
The final close is referred to as the confirmation level. For confirmation, prices must cross over this level.
The lowest of the previous two lows is used to define the stop loss level. The stop loss is triggered if, after the BUY, prices fall instead of rising and close below or make two successive daily lows below the stop loss level without the appearance of a bearish pattern.
 Three White Soldiers
Definition
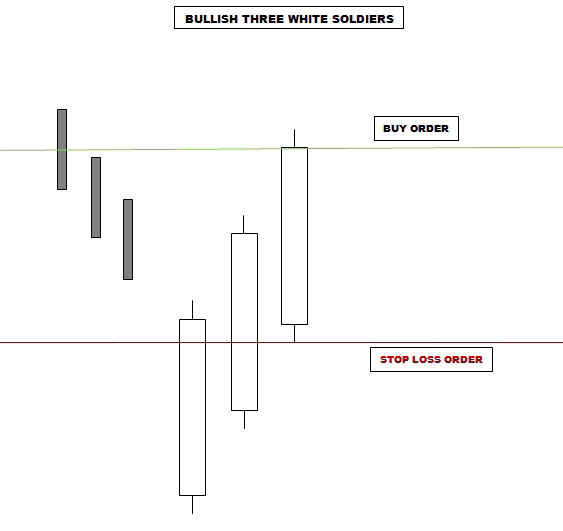
This pattern predicts a significant market reversal. Three regular or long candlesticks that are incrementing upward are what give it away. Each day’s beginning is a little lower than the previous close, and prices gradually close at higher levels. This staircase-like behaviour denotes a trend reversal.
Recognition Criteria
- The market has a strong downtrend that dominates.
- Three normal or lengthy white candlesticks are seen in a row.
- Each candlestick lights up inside the body of the day before.
- Candlesticks gradually reach new highs above the previous day as they close.
Pattern Requirements and Flexibility
A series of three consecutive normal or long white candlesticks is known as the Bullish Three White Soldiers. The final two candlesticks must start in the previous candlestick’s range and end higher.
Trader’s Behavior
The pattern develops when the market has been stacked at a low price for an extended period of time. The market is either nearing or has already reached a bottom while continuing to test fresh lows. The first white candlestick serves as proof of a further, determined upward attempt. The next two days will see a continuation of the rally with higher closing. Now, bears must cover short positions.
Buy/Stop Loss Levels
The final close is referred to as the confirmation level. For confirmation, prices must cross over this level.
The previous low is referred to as the stop loss level. The stop loss is triggered if, after the BUY, prices fall instead of rising and close below or make two successive daily lows below the stop loss level without the appearance of a bearish pattern.
 Bullish Deliberation Block
Definition
Three consecutive black candlesticks with lower closes in a downtrend make up this pattern. The Bearish Deliberation Block Pattern is complimented by it.
Recognition Criteria
- There is a strong downward tendency in the market.
- The first day, a black candlestick appears.
- The following day features another black candlestick that opens in the body range of the day before and closes below that day’s close.
- A short black candlestick, a spinning top, or a Doji that gaps below the second day characterises the final day.
Pattern Requirements and Flexibility
It is not advisable to short the first two black candlesticks that occur in the Bullish Deliberation Block. The end of the second day should be at or below the close of the first day, and the second day should open at or higher than the close of the first day. A short black candlestick or a Doji can fill the space left by the gaping third candlestick.
Trader’s Behavior
The downtrend is confirmed by two consecutive black candlesticks, and the bears are happy with the state of affairs. More bears are drawn to the secure decline, and the third day opens below the close of the first. The third day is likewise a down day, which persuades the bears that the downtrend will continue. However, a deeper inspection reveals indications of vulnerability. Each body’s range is reducing day by day, and the third day gaps below form a star, indicating indecision.
Buy/Stop Loss Levels
The halfway between the previous close and the second day’s body bottom is known as the confirmation level. For confirmation, prices must cross over this level.
The lowest of the previous two lows is used to define the stop loss level. The stop loss is triggered if, after the BUY, prices fall instead of rising and close below or make two successive daily lows below the stop loss level without the appearance of a bearish pattern.
 Bearish Hanging Man
Definition
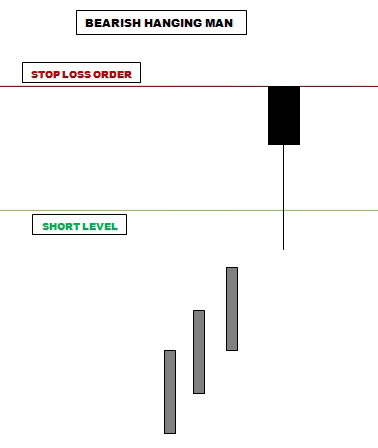
The pattern appears either during an uptrend or at the peak of a trend. Because of how the candlestick resembles a hanging man in some ways, it was given the moniker Hanging Man. It is a single candlestick pattern with a small body at the top of its daily trading range or very close to it and a long lower shadow.
Recognition Criteria
- The market is distinguished by a strong uptrend.
- At the upper end of the trading range, a small real body is seen. The body’s colour is unimportant.
- This candlestick’s lowest shadow is at least twice as long as the body.
- No above shadow is present.
Pattern Requirements and Flexibility
The Hanging Man’s body ought to be compact. The lower shadow shouldn’t be any shorter than a typical candlestick, but it should be at least twice as long as the body. It is preferred that there be no overhead shadow at all. The two white candlesticks that come before it should both be higher than the top of the hanging man’s corpse.
Trader’s Behavior
Known as a bearish reversal pattern, the hanging man. It indicates a resistance level or the top of the market. It indicates that selling pressure is beginning to pick up because it appears after an advance. The price decline during the session was driven by sellers, as seen by the length of the lower shadow. The advent of this selling pressure following a rise is a major warning indicator, even though the bulls reclaimed their footing and raised prices by the conclusion. It may be more negative if the body is black because it indicates that the close was unable to return to the opening price level.
Sell/Stop Loss Levels
The midpoint of the lower shadow of the Hanging Man is referred to as the confirmation level. For confirmation, prices must cross below this level.
The higher of the last two highs is used to establish the stop loss level. If prices rise following a bearish signal and close above the stop loss level or make two consecutive daily highs while no bullish pattern is visible, the stop loss is activated.
 Bearish Belt Hold
Definition
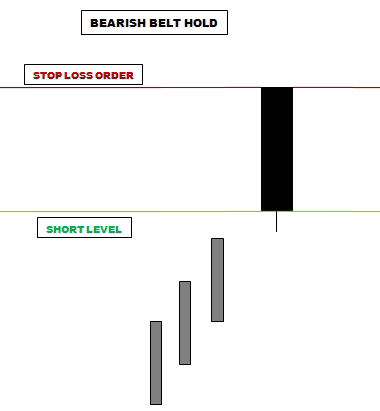
A Black Opening Marubozu, or Bearish Belt Hold, is a single candlestick pattern that appears during an uptrend. It starts off on the day’s high and drops off during the day against the market’s general trend before closing around the day’s low and casting a small shadow at the candle’s base. Longer bodies will provide considerably more resistance to the tendency if the Belt Hold is characterised by it.
Recognition Criteria
- The market is distinguished by a strong uptrend.
- The market gaps up, opens at a high point, and closes close to the day’s low point.
- A Black Opening Marubozu—a long, dark body with no upper shadow—is seen.
Pattern Requirements and Flexibility
There should be a black opening marubozu or a black marubozu (without an upper or lower shadow) that opens higher than the two white candlesticks that came before it.
Trader’s Behavior
With a sizable gap in the direction of the current upswing, the market opens higher. Therefore, the uptrend is still continuing as seen by the starting price. After the market opens, though, things quickly shift, and the market starts moving the other way. The bulls are quite concerned about this, which prompts them to sell a lot of positions, which could change the trend and trigger a sell-off.
Buy/Stop Loss Levels
The final close is referred to as the confirmation level. For confirmation, prices must cross below this level.
The most recent high is the stop loss level. If prices rise following a bearish signal and close above the stop loss level or make two consecutive daily highs while no bullish pattern is visible, the stop loss is activated.
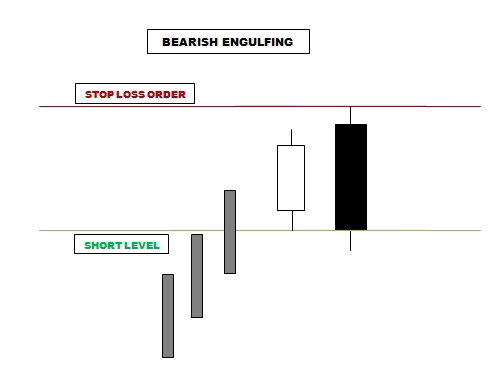 Bearish Engulfing
Definition
This pattern develops during an uptrend and is characterised by a huge black body enveloping a smaller white body that came before it. The black body completely envelops the body rather than only the shadows of the white body. This top reversal signal is significant.
Recognition Criteria
- The market is distinguished by a strong uptrend.
- On the first day, a white body is observed to form.
- The white body from the first day is completely engulfed by the black body that forms on the second day.
Pattern Requirements and Flexibility
The first white candlestick’s length is unimportant. Also, it might be a Doji. But the second one must be a standard or long black candlestick. If the two candlesticks’ body tops or bottoms are at the same level, the Bearish Engulfing Pattern’s black body should be longer than the white body that came before it.
Trader’s Behavior
Even though there is a clear upswing in the market, the presence of a white body on the first day results in decreased buying activity. The market debuts the following day at fresh highs. It appears as though there would be more positive trade, but the uptrend loses steam and the bears gain control throughout the day. In the end, the market finishes below where it opened the previous day as selling pressure prevails over purchasing. The upswing has been harmed.
Buy/Stop Loss Levels
The final close is referred to as the confirmation level. For confirmation, prices must cross below this level.
The most recent high is the stop loss level. If prices rise following a bearish signal and close above the stop loss level or make two consecutive daily highs while no bullish pattern is visible, the stop loss is activated.
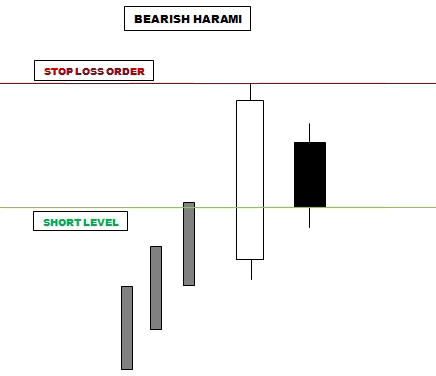 Bearish Harami
Definition
This pattern consists of a little, totally inside the white body’s range black body and a white body. If the pattern’s outline is drawn, it resembles a pregnant woman. There is no chance behind this. An ancient Japanese word for “pregnant” is “harami.” The little candlestick represents “the baby,” while the white candlestick serves as “the mother.”
Recognition Criteria
- The market is distinguished by a strong uptrend.
- Day one includes the observation of a white body.
- The body from the first day completely engulfs the black body that forms on the second day.
Pattern Requirements and Flexibility
Two candlesticks make up the pattern, with the white candlestick appearing on the first day and the black candlestick appearing on the second. The first candlestick ought to be a standard or long white candlestick. The black body should be smaller than the preceding white body, regardless of whether the body tops or body bottoms of the two candlesticks are at the same level.
Trader’s Behavior
The Bearish Harami indicates that the market’s health is uneven. The market is in an upswing and has a bullish attitude, and strong buying is being seen as indicated by a white body, which encourages the bullishness even more. The prices open lower the following day or at the close of the day before, stay in a narrow range all day, and close even lower, but within the range of the previous day. Due to this abruptly worsening trend, traders are increasingly worried about the market’s strength.
Buy/Stop Loss Levels
The final close or the midpoint of the first white body, whichever is lower, is considered the confirmation level. For confirmation, prices must cross below this level.
The higher of the last two highs is used to establish the stop loss level. If prices rise following a bearish signal and close above the stop loss level or make two consecutive daily highs while no bullish pattern is visible, the stop loss is activated.
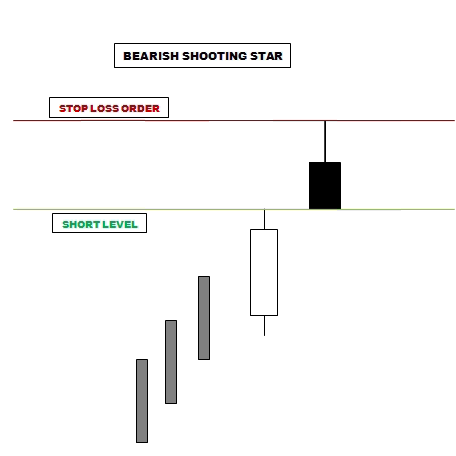 Bearish Shooting Star
Definition
This pattern starts with a white body, which is followed by an Inverted Hammer with a small body and a long upper shadow. The Shooting Star pattern resembles the Bullish Inverted Hammer pattern in shape, but unlike it, it appears during an uptrend and denotes a bearish reversal.
Recognition Criteria
- The market is distinguished by a strong uptrend.
- White candlesticks make up the pattern’s first day.
- On the second day, a small body is seen near the bottom of the trading range. The body’s colour is unimportant.
- This second candlestick’s upper shadow ought to be at least twice as long as the body.
- Nearly no lower shadow exists.
Pattern Requirements and Flexibility
The Inverted Hammer’s body ought to be compact. The length of the upper shadow must be at least twice that of the body but not less than that of a typical candlestick. It is preferred that there be no lower shadow or very little of one. The body of the Inverted Hammer should have a higher top than the body of the candlestick before it.
Trader’s Behavior
The white candlestick that comes on the first day of the pattern adds to the bullishness, which is present in the background of the pattern. The market opens at or close to its low on the second day after an inverted hammer is seen. Then the price movement reverses, and we witness a rally. However, the bulls are unable to maintain the rally throughout the rest of the day, and prices eventually close at or very close to the day’s low. This will undoubtedly worry those bulls who have profitable holdings.
Buy/Stop Loss Levels
The low of the Inverted Hammer’s body is referred to as the confirmation level. For confirmation, prices must cross below this level.
The most recent high is the stop loss level. If prices rise following a bearish signal and close above the stop loss level or make two consecutive daily highs while no bullish pattern is visible, the stop loss is activated.
 Bearish Doji Star
Definition
This pattern signals a change in trend when it shows up during an uptrend. It consists of a Doji with a gap up at the opening and a white candlestick. “Bearish Dragonfly Doji” is the name of the design if the Doji takes the shape of an umbrella. “Bearish Gravestone Doji” is the term used to describe an inverted umbrella. Regardless of the Doji’s shape, all of these patterns are collectively referred to as “Bearish Doji Star” in this instance.
Recognition Criteria
- The market is distinguished by a strong uptrend.
- A white candlestick is used on the first day.
- Then, on the second day, we witness a Doji that gaps up.
Pattern Requirements and Flexibility
A standard or long white candlestick should be the first element of the Bearish Doji Star. The next thing must be a Doji gapping up.
Trader’s Behavior
A powerful white candlestick further reinforces the market’s upward trend. The trade is in a narrow range the following day as it starts out higher with a gap up. A Doji is formed when the day ends at the price it started at. During the upswing, bulls were in charge, but the appearance of a Doji star, which signifies that the bulls and the bears are in harmony, now suggests a change. The increasing momentum is fading. The odds against a bull market continuing are not good.
Buy/Stop Loss Levels
The middle of the distance between the Doji and the preceding candlestick is known as the confirmation level. For confirmation, prices must cross below this level.
The higher of the last two highs is used to establish the stop loss level. If prices rise following a bearish signal and close above the stop loss level or make two consecutive daily highs while no bullish pattern is visible, the stop loss is activated.
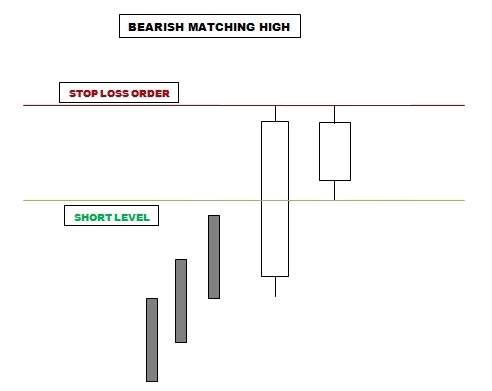 Bearish Matching High
Definition
When two white days with equal closes appear in an upward trend, this pattern develops. Even though the new high was tested and there was no follow-through, it suggests a top has been reached, which is a sign of a good resistance price.
Recognition Criteria
- The market is distinguished by a strong uptrend.
- Day one includes the observation of a white body.
- Another white candlestick with a similar closing price to the prior day’s closing price appears on the second day.
Pattern Requirements and Flexibility
Two white candlesticks make up the Bullish Matching High. The first candlestick should be typical or long in length. It is ideal for both candlesticks to close at the same point.
Trader’s Behavior
Another solid white day serves as further proof that the market has been rising. The price is the same when it closes on the same day after opening lower and trading much lower. This is a sign of near-term resistance and will worry the bulls a lot. The psychology of the market has more to do with the fact that both days end at the same level than it does with the actual daily trading action.
Buy/Stop Loss Levels
The middle of the first white body is referred to as the confirmation level. For confirmation, prices must cross below this level.
The higher of the last two highs is used to establish the stop loss level. If prices rise following a bearish signal and close above the stop loss level or make two consecutive daily highs while no bullish pattern is visible, the stop loss is activated.
 Bearish Kicking
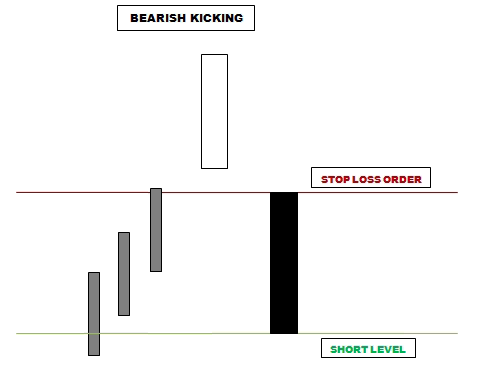
Definition
A white Marubozu appears first in this pattern, followed by a black Marubozu. Following the white Marubozu, the market opens lower than it did the previous session, creating a space between the two lines.
Recognition Criteria
- The market is distinguished by a strong uptrend.
- A white Marubozu (or white candlestick) is used on the first day.
- On the second day, a black Marubozu (or black candlestick) appears.
- The second day begins with a body gap and is lower.
Pattern Requirements and Flexibility
The perfect Bearish Kicking should have a body gap in between the black and white Marubozus of the pair. We also accept a null body gap and normal or lengthy candlesticks. In this way, the continuation pattern known as the Bearish Separating Lines Pattern (which is not discussed here) is also included in a modified way as a reversal pattern.
Trader’s Behavior
The pattern is a powerful indicator that the market is declining. It seems to be moving upward, and the first day’s big white candlestick adds to the bullishness. Prices open below (or at) the previous day’s open the following day, creating a gap. The bears are propelled to action by this enormous separation. With a dark candlestick, the market is now declining.
Buy/Stop Loss Levels
The final close is referred to as the confirmation level. For confirmation, prices must cross below this level.
The most recent high is the stop loss level. If prices rise following a bearish signal and close above the stop loss level or make two consecutive daily highs while no bullish pattern is visible, the stop loss is activated.
 Bearish Evening Star
Definition
This three-candlestick pattern denotes a significant top reversal. It is made out of a short, white candlestick that typically gaps up into a star, followed by a white candlestick. The third black candlestick, whose close is well inside the white body of the first session, follows. This top pattern has significance.
Recognition Criteria
- The market is distinguished by a strong uptrend.
- On the first day, a white candlestick is visible.
- Then, on the second day, we observe a brief candlestick that gaps in the upward direction.
- On the third day, a black candlestick is observed.
Pattern Requirements and Flexibility
The white candlestick that marks the beginning of the Bearish Evening Star should be followed by a short candlestick (either white or black) that opens with a gap upward. The third-day black candlestick should open at or below the second candlestick’s body’s greatest level, and it should close well within the white candlestick that first appears in the pattern. According to the other candlesticks in the pattern, the minimum level at which this candlestick must close is determined. The conclusion of the third day must fall halfway between the beginning of the first day and the peak body level of the second day.
Trader’s Behavior
There is an uptrend present, and the white candlestick verifies the upswing’s persistence. The emergence of a short candlestick with a gap shows that bulls are still driving the price higher. The second day’s tight price movement between open and close, however, reveals uncertainty. A black body inhabits the first day’s white body on the third day. There has been a big trend reversal.
Buy/Stop Loss Levels
The final close is referred to as the confirmation level. For confirmation, prices must cross below this level.
The higher of the last two highs is used to establish the stop loss level. If prices rise following a bearish signal and close above the stop loss level or make two consecutive daily highs while no bullish pattern is visible, the stop loss is activated.
 Bearish Tri Star
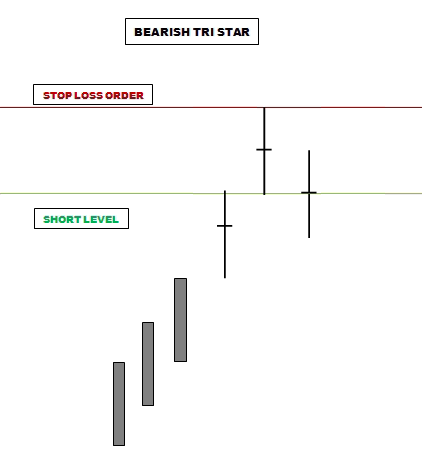
Definition
The pattern consists of three Doji in succession. This pattern is extremely uncommon, so when it does appear, it should not be disregarded.
Recognition Criteria
- The market is distinguished by a strong uptrend.
- There are three Doji visible in a row.
- The second day is separated from the first and third by a gap.
Pattern Requirements and Flexibility
The second Doji gaps above the previous two Doji to form the Bearish Three Star, which consists of three Doji in a row. The fact that the gap is a body gap suffices. The space between shadows is not necessary.
Trader’s Behavior
On the event of a Bearish Tri Star, the market has been in an extended upswing. The smaller bodies, on the other hand, are likely a sign of the deteriorating trend. The initial doji raises some red flags. The market is losing direction, as shown by the second Doji. The third doji signals the end of the uptrend in the end. This pattern denotes a lack of decision-making that caused positions to be switched.
Buy/Stop Loss Levels
The final close is referred to as the confirmation level. For confirmation, prices must cross below this level.
The higher of the last two highs is used to establish the stop loss level. If prices rise following a bearish signal and close above the stop loss level or make two consecutive daily highs while no bullish pattern is visible, the stop loss is activated.
 Bearish Tri OutSide Down
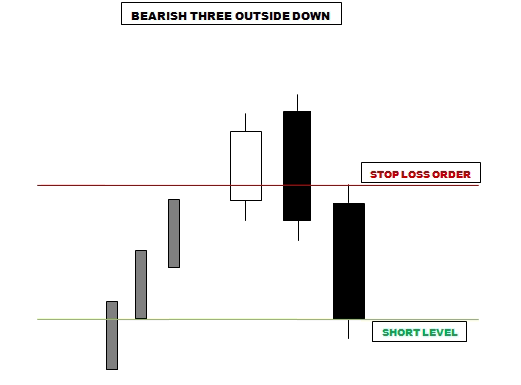
Definition
This bearish engulfing pattern has been verified. The Bearish Engulfing pattern is exactly replicated in the first two lines, and the third day serves as confirmation of the pattern.
Recognition Criteria
- The market is distinguished by a strong uptrend.
- In the first two days, a Bearish Engulfing pattern is visible.
- On the third day, we then observe a black candlestick with a lower closing than the previous day.
Pattern Requirements and Flexibility
All the guidelines previously established should be used to recognise a bearish engulfing pattern. The third day ought to have a negative tone and a lower close.
Trader’s Behavior
The first two days of the Bearish Three Outside Down are just a Bearish Engulfing Pattern, and the third day, which is a black candlestick closing with a new low for the past three days, confirms that the uptrend is damaged as suggested by this pattern. A second confirmation is still required, though, for a bearish reversal.
Buy/Stop Loss Levels
The final close is referred to as the confirmation level. For confirmation, prices must cross below this level.
The most recent high is the stop loss level. If prices rise following a bearish signal and close above the stop loss level or make two consecutive daily highs while no bullish pattern is visible, the stop loss is activated.
 Bearish Three Gap Ups
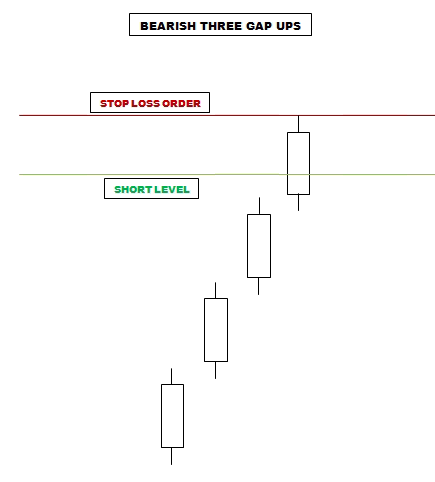
Definition
This bearish reversal pattern has four days. It comprises of three days in a row with higher opening gaps. The market becomes extremely overbought and prepared for the current uptrend to reverse after three gap ups.
Recognition Criteria
- Any colour may be used for the first day.
- Any colour is acceptable for the second day as long as its body separates from the first day’s body.
- The bodies of the past two days must gape up from the bodies of the earlier days because they are white.
Pattern Requirements and Flexibility
Days one and two of the Bearish The latter two days must be white, but the other three Gap Ups can be any colour. There must be spaces between the candlesticks for upside-down bodies.
Trader’s Behavior
With three straight gaps upward, the market is overbought, and now is the time to take profits.
Buy/Stop Loss Levels
The middle of the final white body is referred to as the confirmation level. For confirmation, prices must cross below this level.
The higher of the last two highs is used to establish the stop loss level. If prices rise following a bearish signal and close above the stop loss level or make two consecutive daily highs while no bullish pattern is visible, the stop loss is activated.
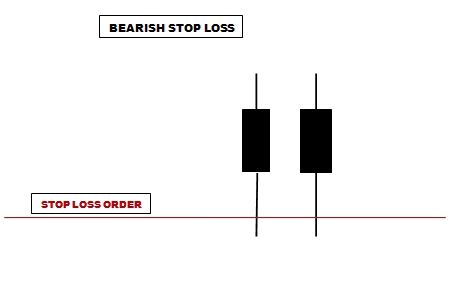 Bearish Stop Loss
Definition
This does not follow the typical candlestick pattern. The stop loss complement of all recognised bullish patterns is all that it is. Two consecutive lows or a close below the stop loss level of a recently confirmed bullish pattern are required for the bearish stop loss to be activated.
Recognition Criteria
- The confirmation and stop loss levels of a bullish pattern are identified.
- Once the pattern is confirmed, a buy signal is given.
- Prices either hit lows below the stop loss level twice in a row or close once below the stop loss level.
- It triggers the bearish stop loss.
Pattern Requirements and Flexibility
All bullish candlesticks have a certain stop loss level that, once the pattern is confirmed, goes into effect. Therefore, a bullish confirmation could result in a bullish BUY signal. The stop loss is triggered if, after the BUY, prices fall instead of rising and close below or make two successive daily lows below the stop loss level without the appearance of a bearish pattern. Once activated, the stop loss level of the most recent bullish pattern confirmation begins to function as the confirmation level of a bearish pattern itself. In order to send out a SELL or SHORT signal, the system then looks for a bearish confirmation. For the triggered stop loss to be considered bearish, prices must cross below the stop loss level.
Trader’s Behavior
It is difficult to predict that all bullish wagers would succeed in the tumultuous stock market climate. However, the majority of bullish wagers supported by valid candlestick patterns will succeed. However, some candlestick patterns, some of which are bull traps, may result in erroneous trades. The stop loss is specifically useful in this situation. For the bulls, it acts as a safety valve, reducing the potentially disastrous losses to a manageable level. The statistics show that trades based on confirmations of bearish stop losses are just as profitable as signals based on other candlestick patterns. They should never be avoided if verified.
Buy/Stop Loss Levels
The stop loss level of the most recent confirmed bullish candlestick pattern is known as the confirmation level. Prices need to close below this level in order for the bearish stop loss to be validated.